Container Shipping Reliability Fell to 27%. Europe Is at 4%. Here's What That Does to Your Cargo.
In one paragraph: Global container schedule reliability dropped for the fourth consecutive month to 27% in September, with average delays of six days. The Asia–Europe trade is the worst affected: only 4% of vessels arrived on time, with an average delay of 9.9 days — the weakest reading since 2021. Trans-Pacific reliability held at 20%, but delays widened to 6.9 days while spot rates to the US West Coast reached $7,717 per FEU, more than four times last year's level. The operational risk has shifted from finding space to predicting arrival.
How bad is container shipping reliability right now?
Four months of decline, and no floor yet. According to Xeneta's monthly reliability data, 27% of container ships arrived on schedule in September — meaning roughly seven in ten vessels missed their proforma arrival. The global average delay stretched to six days.
| Trade lane | On-time reliability (Sept) | Average delay | Direction |
|---|---|---|---|
| Global average | 27% | 6.0 days | Fourth straight monthly decline |
| Asia–Europe | 4% | 9.9 days | Worst since 2021 |
| Trans-Pacific | 20% | 6.9 days | Flat reliability, longer delays |
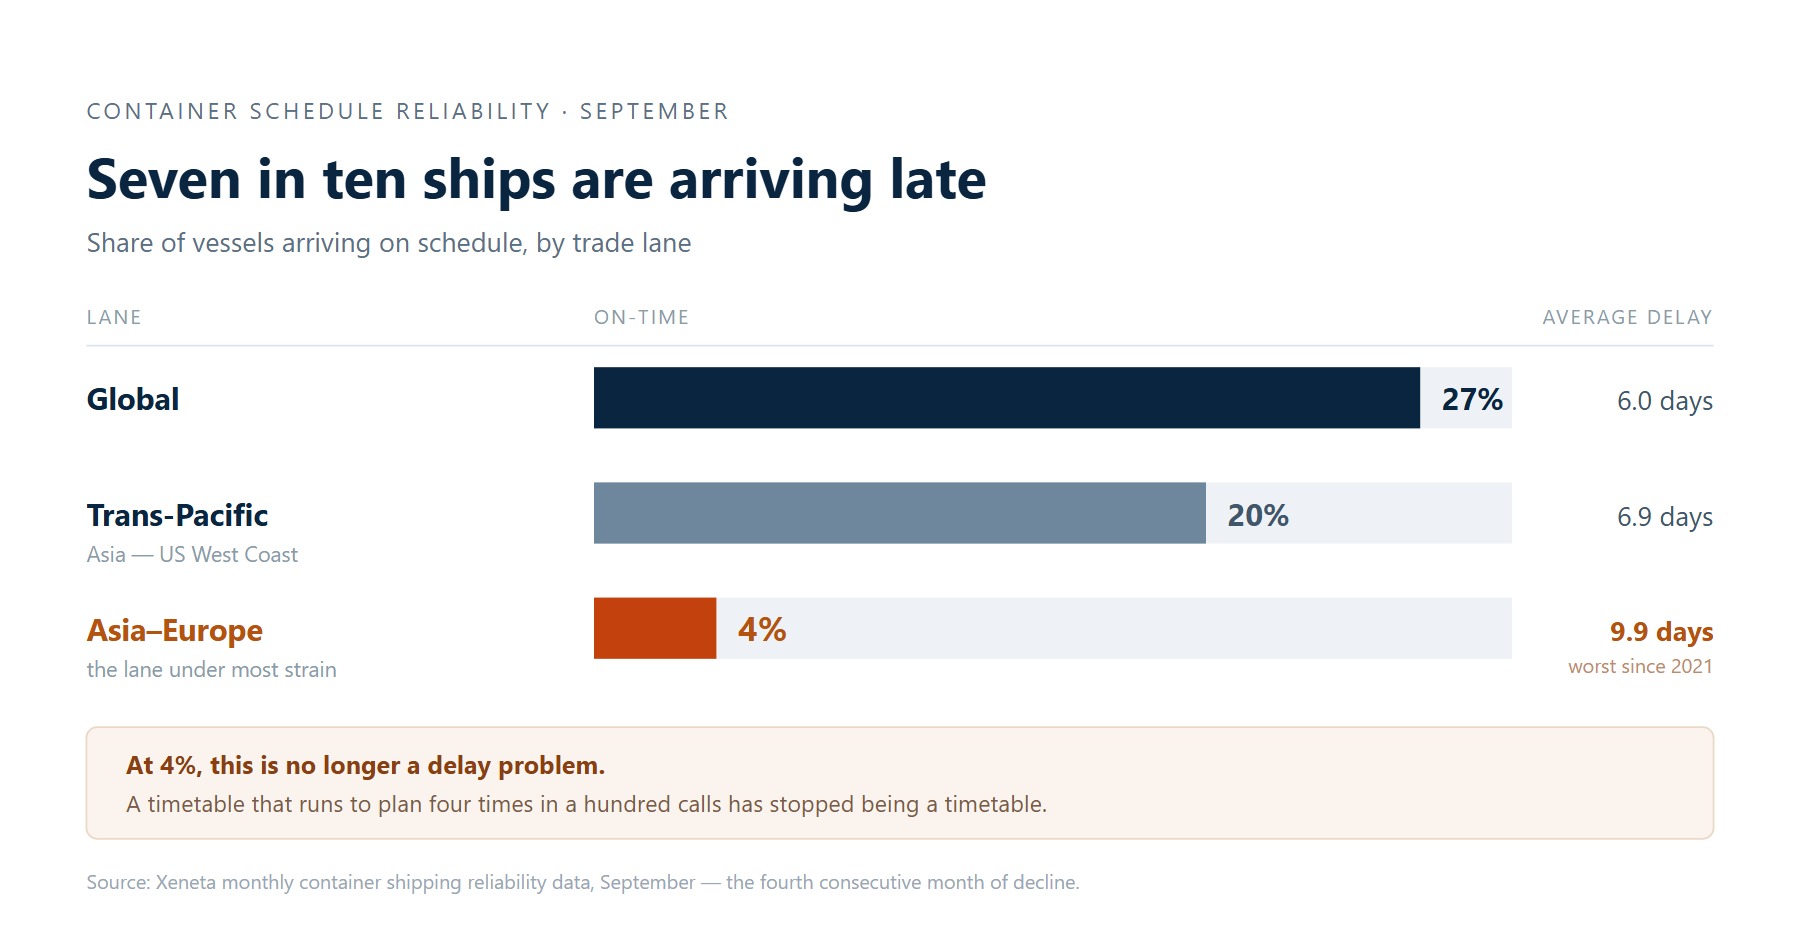
Read the table by row, not by average. A 27% headline hides the fact that the two lanes carrying most Asian export volume are running at 4% and 20%. If your cargo moves on either, the global number is not your number.
Why is Asia–Europe down to 4%?
Because the lane has the least slack and the longest chain. A 4% on-time rate is not a delay problem; it is a schedule that has effectively stopped functioning as a timetable and become a sequence of arrival estimates.
The average delay on Asia–Europe reached 9.9 days, the highest since 2021 — the year of the Suez blockage and the post-pandemic equipment crunch. Two consequences follow directly:
- Factory schedules break first. Production plans assume an arrival date and a safety stock calculated against it. A ten-day slip consumes that buffer in one cycle.
- Warehouse stockpiles break second.Replenishment windows compress, so the next order has to be placed before the previous one is confirmed as landed.
For exporters, the practical translation is that a 30-day transit has become a 40-day planning assumption, and the difference has to be financed somewhere — in inventory, in air freight for the urgent SKUs, or in stockouts.
What is happening on the trans-Pacific, and how high are rates?
Reliability stayed flat at 20%; cost did not. Delays on the trans-Pacific grew to 6.9 days, and spot rates to the US West Coast reached $7,717 per FEU — more than four times higher than the same period last year.
That combination is the harder one to manage. Europe is a reliability problem: the ships are late. The trans-Pacific is a reliability plus priceproblem: the ships are late and each slot costs four times what it did. Rate spikes of that size usually mean the market is being cleared by price, which is exactly when booked space gets rolled to the next vessel.
If typhoons caused this, why does the system keep breaking?
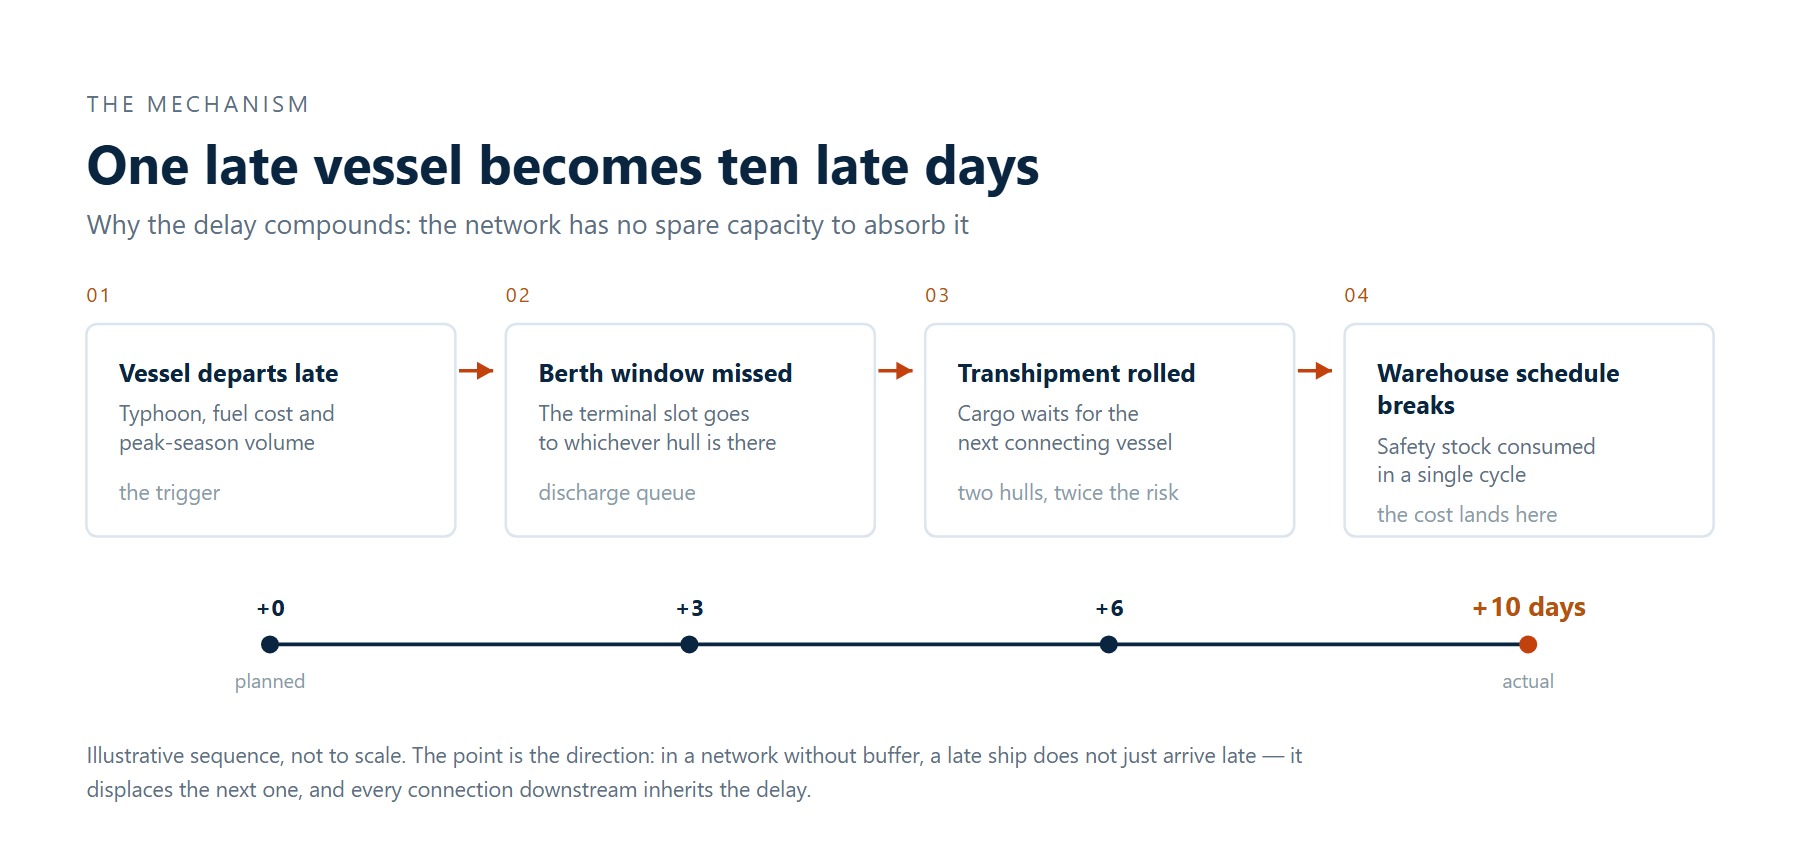
Typhoons triggered it. The system was already full.
Xeneta attributes the September collapse to a mix of typhoon disruption, high fuel costs and peak-season demand. All three are real. None of them explains why one bad weather week propagates for a month — that is a structural property, not a weather event.
Global container networks have run for years with almost no buffer: vessel utilization high, berth windows tight, equipment circulating with no reserve. In a network with slack, a late ship is absorbed. In a network without slack, a late ship displaces the next one, which displaces the one after it, and the delay compounds across every port call and connection downstream.
This is why the recovery curve is always slower than the disruption curve. It is also why "the weather has passed" is not a signal that your cargo is moving again.
Are the new shipping alliances performing better? The Gemini case
No — and the data is unusually blunt. The Gemini cooperation network's reliability fell from 70% in June to 40% in September.
The design logic behind Gemini was sound: fewer port calls, tighter hub-and-spoke routing, more reliable proforma schedules. Fewer stops means fewer places to be late. But a lean network has less absorption capacity, not more. When disruption arrives, a system with fewer nodes and no reserve degrades faster than a messy one with redundancy.
The lesson for shippers is not that alliances fail. It is that schedule reliability is not a property of an alliance's design — it is a property of the network's spare capacity at the moment you ship.
Where is congestion building? Singapore and the hub layer
Pressure is spreading from the lanes into the hubs. At Singapore, the number of ships waiting doubled in September, and average waiting time rose from 1.9 to 3.1 days.
Hub congestion is the mechanism that converts a lane-specific delay into a network-wide one. A vessel waiting off Singapore misses its next berth window in Europe; that berth window is then taken by a vessel that was already behind. Transhipment cargo is the first to feel it, because it changes hulls twice instead of once.
If your routing includes a transhipment leg, add the hub wait to your transit estimate explicitly. Most transit-time calculators do not.
Will carriers cancel more sailings in October?
Probably yes. Carriers kept capacity in the water through September — they were reluctant to cut sailings during peak season, when every slot is revenue. Forward-looking plans point the other way: up to 17% of Asia–Europe sailings could be withdrawn in October.
Blank sailings are the carriers' standard instrument for defending rate levels when demand softens or schedules are already unstable. The side effect is that the sailing you booked may not exist by the time your cargo is ready, and the replacement arrives a week later with a heavier load.
What should exporters and freight forwarders do now?
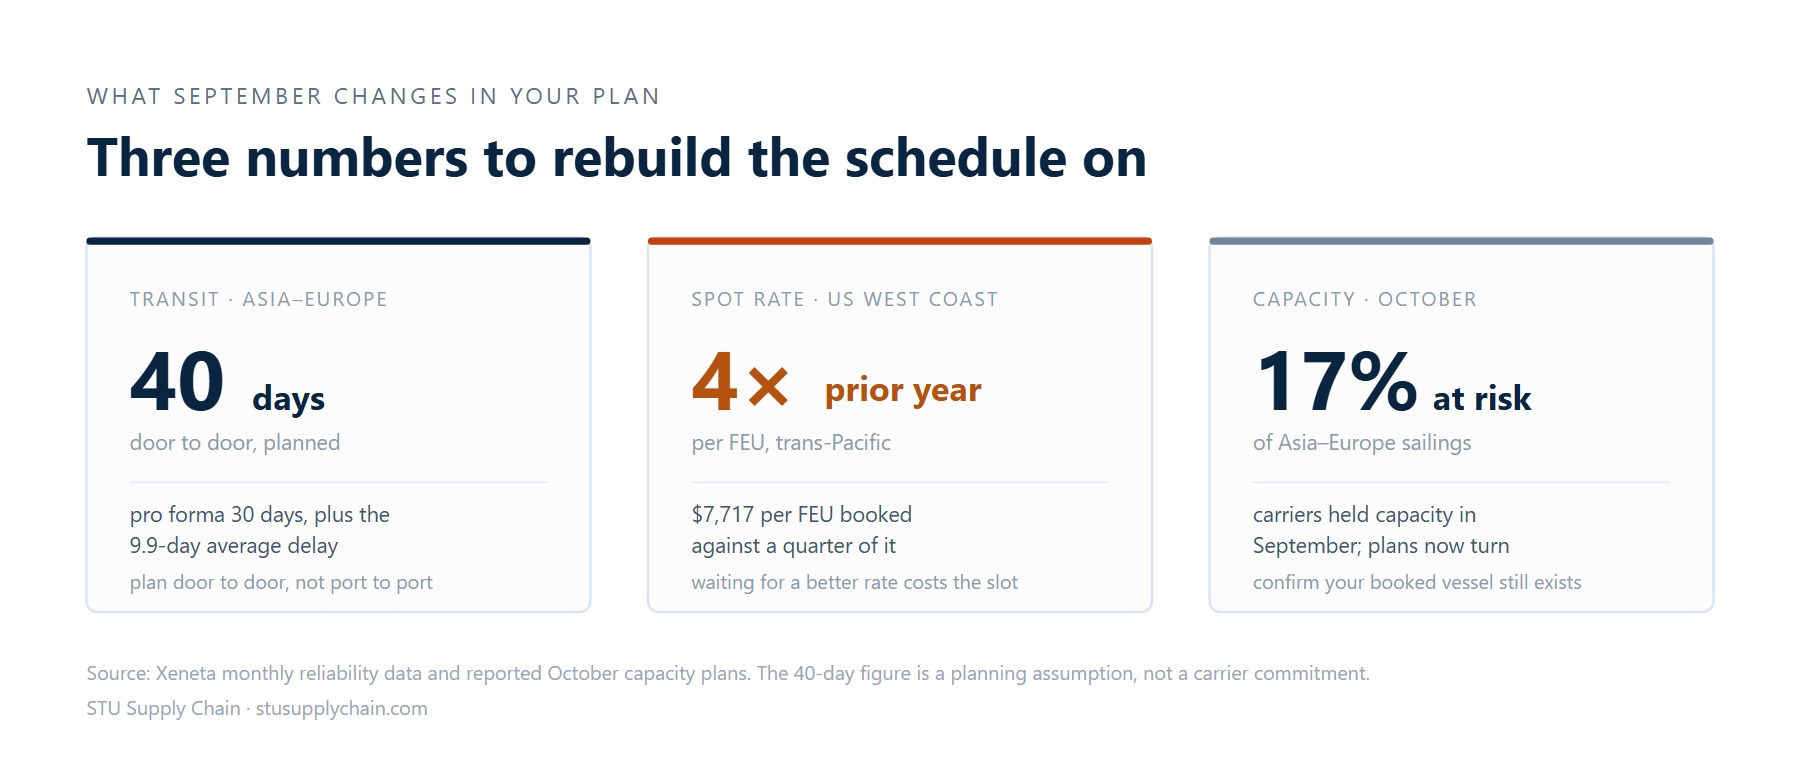
Five moves, in order of impact:
Re-base transit time, not just cost. Quote and plan against 9.9 days of average delay on Europe and 6.9 on trans-Pacific. If your planning system still uses proforma transit, it is now systematically wrong.
Convert one buffer into two. Hold a small finished-goods buffer near the destination market and a small component buffer at origin. A single large buffer at one end fails exactly when the lane fails.
Book earlier than the rate tells you to. In a market clearing by price, waiting for a better rate usually means losing the slot rather than saving money.
Track at container level, not at booking level. Booking status tells you what you bought. Container events tell you where your cargo is.
Pre-plan the exception. Decide in advance which SKUs justify air freight, and at what stock level you trigger it. Deciding during a stockout costs more.
The real risk has changed
Twelve months ago the question was whether you could get a container. Today, on Asia–Europe at 4% and trans-Pacific at $7,717 per FEU, the question is when the container you already paid for will actually arrive.
That is a different capability: not procurement, but visibility and contingency. It is also the part of ocean freight that a rate quote cannot cover.
If you are shipping out of Asia and want the schedule watched on your behalf — booking status, container events, rollover risk and the October blank-sailing picture for your lane — STU Supply Chain works with exporters and forwarders on exactly that layer. Send us your lane and monthly volume, and we will come back with a routing and buffer plan built on the current delay figures rather than last year's timetable.
FAQ
Is container shipping reliability getting better or worse? Worse, on the latest reading. Global schedule reliability fell for the fourth consecutive month to 27% in September, with the Asia–Europe lane at 4% and trans-Pacific at 20%. There is no sign of a turnaround in the October sailing plans.
How long are shipping delays from China to Europe right now? Add about 10 days to proforma transit. The average delay on Asia–Europe was 9.9 days in September, the worst since 2021. A 30-day port-to-port transit should be planned as roughly 40 days door-to-door once port and inland legs are included.
What is a blank sailing? A blank sailing is a scheduled voyage that the carrier withdraws, usually to control capacity and defend freight rates. Up to 17% of Asia–Europe sailings may be cancelled in October, which means a booked sailing can disappear and cargo is rolled to the next available vessel.
Why did reliability fall even though alliances reduced port calls? Because fewer port calls remove redundancy as well as delay. The Gemini network cut stops and still fell from 70% reliability in June to 40% in September: a lean network has less capacity to absorb disruption, so it degrades faster when disruption arrives.
Are freight rates still rising? On the trans-Pacific, yes. Spot rates to the US West Coast reached $7,717 per FEU, more than four times last year's level. Rate direction on Asia–Europe depends largely on how many October sailings carriers actually withdraw.
What is the single most useful change a shipper can make this quarter? Replace proforma transit time with observed transit time in planning, and split the safety stock across origin and destination. Both are cheap, and both address the actual failure mode — late arrival, not unavailable space.


Comments
Post a Comment